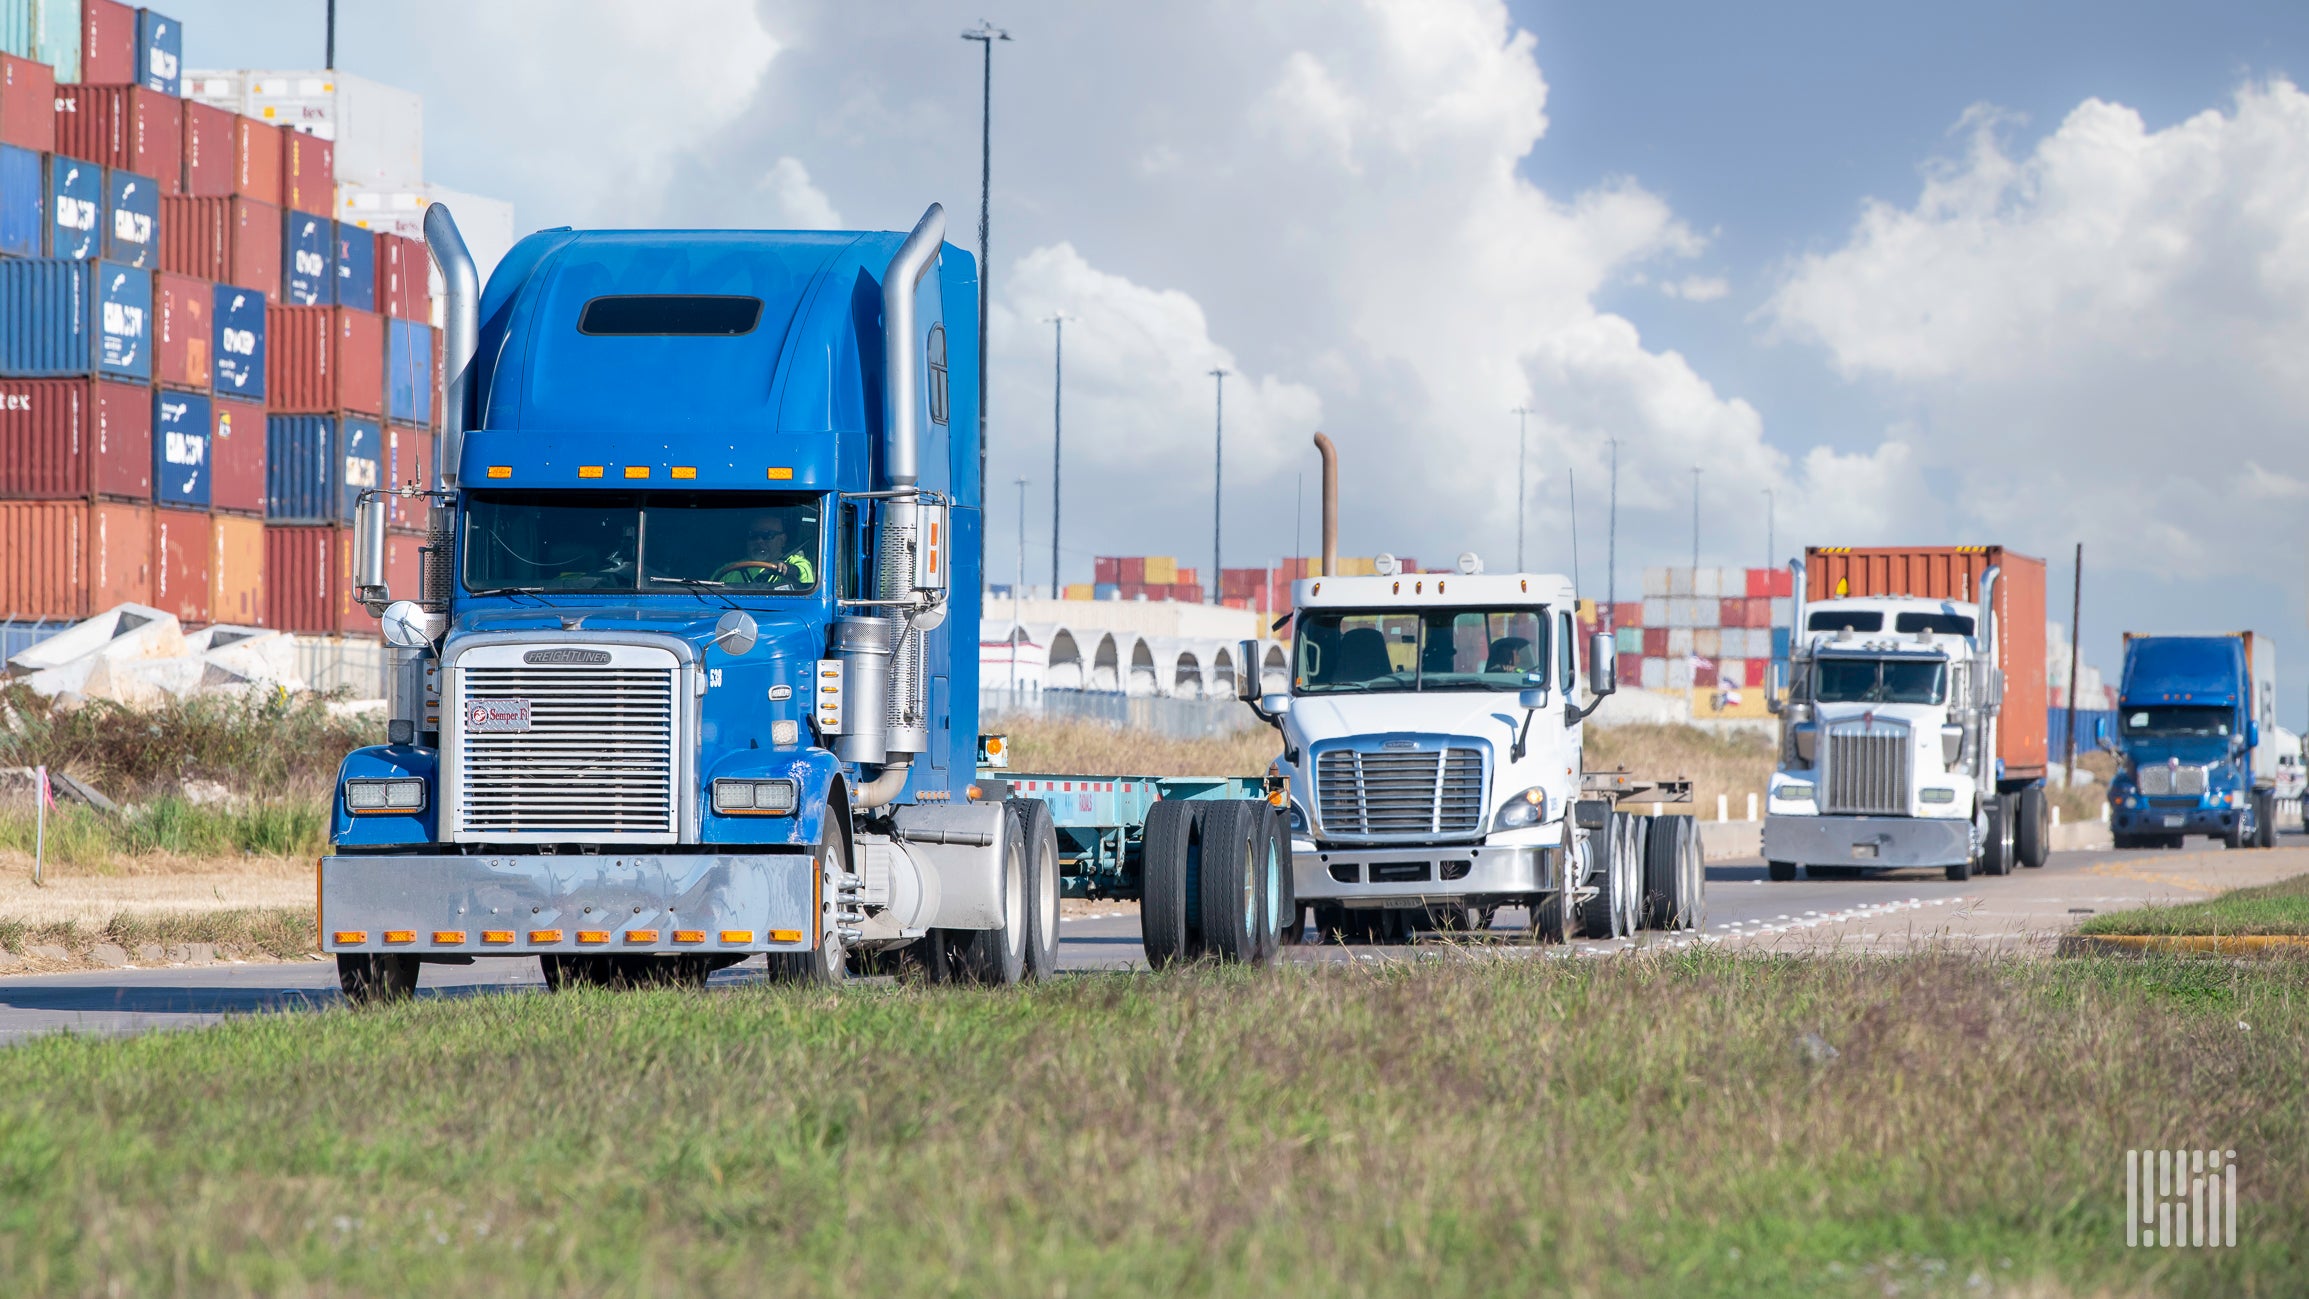
Port Houston sees April cargo dip, expects rebound in May
Port Houston handled 353,319 TEUs in April, down 10% from March and 9% year over year, marking the port’s first quarterly container decline since early 2025 as global trade volatility and softer steel imports weighed on volumes.
However, port executives said cargo activity is already recovering in May, with imports once again driving growth.
Port Houston CEO Charlie Jenkins said the port is still seeing strong vessel activity despite the temporary slowdown in containers.
“In April, we had 754 vessel visits in the port, which is 6% more than last April,” Jenkins said during the Port Commission meeting Wednesday. “But we’re seeing this volume increase every single month.”
Jenkins said larger vessels moving through the Houston Ship Channel are helping drive export growth, particularly energy-related commodities.
“Export tonnage is up 19% this year,” Jenkins said. “Crude oil, refined products, petroleum gases are driving a lot of this growth.”
Port Houston remained the world’s top export gateway for liquefied petroleum gases such as propane, butane and methane, according to Jenkins.
“Exports of petroleum gases are up 33%, and we remain the number one port in the world for gases like butane, propane and methane,” Jenkins said.
Container volumes soften in April
According to Port Houston’s monthly statistics report, total container throughput reached 353,319 TEUs in April, down 10% compared to March and down 9% year over year.
Year-to-date container volumes totaled 1.44 million TEUs, down 1% compared to the same period in 2025.
Loaded import containers totaled 162,798 TEUs in April, down 8% year over year, while loaded export containers fell 5% to 132,339 TEUs. Empty export containers declined 18% year over year.
Port Houston Chief Port Operations Officer Ryan Mariacher said April’s decline followed a strong first quarter and should not be viewed as a long-term trend.
“April presented a decline or normalization in volume after a strong March and first quarter,” Mariacher said. “But despite the decline, total tonnage remains up 3%, as we’ve handled over 18.5 million tons through April.”
Mariacher said import cargo is already showing signs of recovery in May.
“The good news again in May is if you look at our volumes through yesterday, total TEU is actually up 1% with imports driving that growth once again,” Mariacher said.
Combined loaded container volumes at Bayport and Barbours Cut terminals declined nearly 7% year over year in April, though Mariacher said overall performance remains stable relative to recent quarters.
“Combined volumes through April at the container terminals Bayport and Barber’s Cut resulted in a decrease in loaded units of nearly 7% versus last April,” Mariacher said. “But the good news is the month remained on average for the preceding three quarters.”
Steel imports remain weak while bulk cargo rises
Steel imports through April totaled 1.05 million tons, down 29% year over year, continuing a trend port officials have been tracking for months.
“The steel decline continued as we expected, dropping another percent, now down 28% year to date,” Mariacher said.
However, Mariacher noted May could provide a turnaround for steel cargoes.
“The good news here is May is forecasted to be the largest month for steel volumes since last July,” he said.
Dry bulk tonnage remained one of the port’s strongest cargo segments, increasing 44% year to date to 2.25 million tons, while liquid bulk cargo volumes climbed 20% year over year to 1.13 million tons.
Total revenue tonnage for the port reached 18.56 million tons through April, up 3% year over year.
ILA’s McNamara enters International Maritime Hall of Fame
Veteran New York-New Jersey longshore union executive James W. McNamara is the newest member of the International Maritime Hall of Fame.
McNamara was inducted by International Longshoremen’s Association International President Harold J. Daggett at a ceremony this week at The Lighthouse at New York’s Chelsea Piers.
Chief of Staff McNamara, the union’s spokesman, has spent 44 years with the ILA, and was honored for his enduring leadership, advocacy for longshore workers, and transformative charitable contributions to the maritime community. He joined the union during a period of major upheaval spurred by containerization and remained committed to his role, helping to shape the modern ILA into the strong, unified organization it is today. He also helped raise more than $10 million for the ILA Children’s Fund.
Also honored were Robert P. Burke, chief executive of Ridgebury Tankers; Capt. John W. Murray, CEO, Canaveral Port Authority; and Ted Tregurtha, president and CEO, Moran Towing.
“These leaders have tirelessly championed progress, elevating the standards of our entire community,” said Executive Director Stephen Lyman of the Maritime Association of the Port of New York/New Jersey.
Robinson Fresh opens border cold-chain hub as Mexico produce imports grow
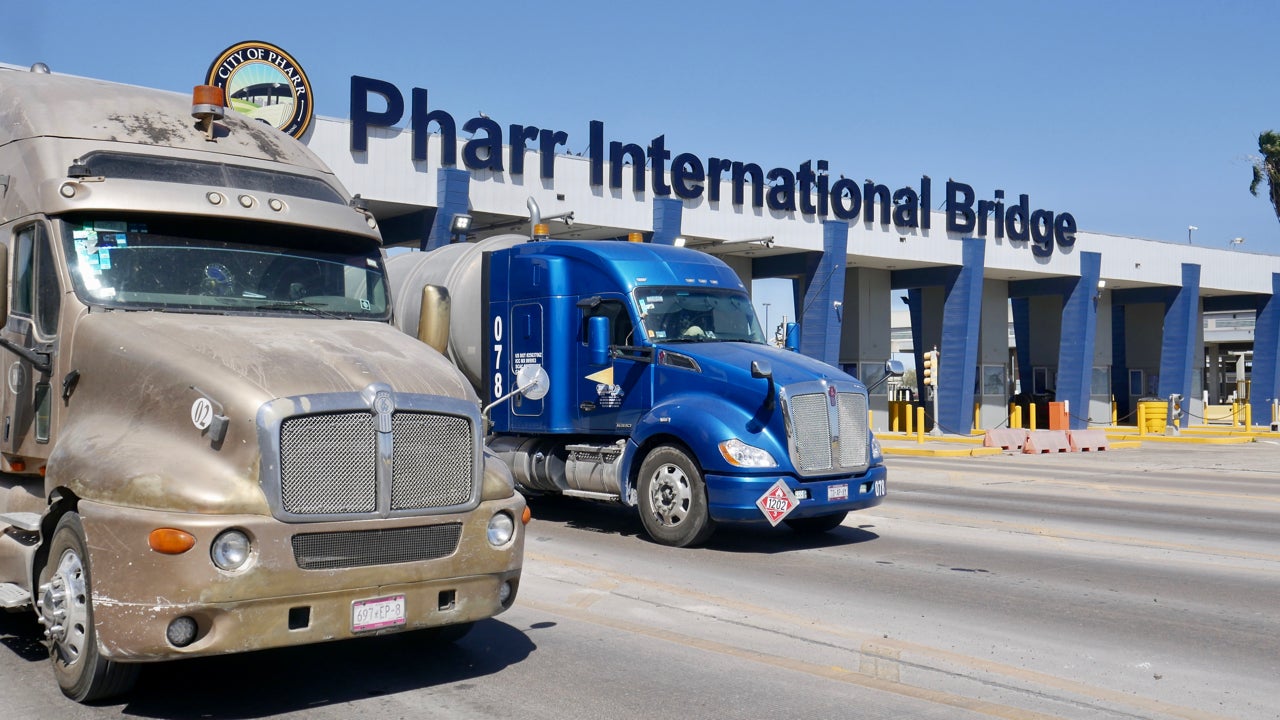
Robinson Fresh has opened a new 142,600-square-foot logistics center in Pharr, Texas, expanding its cross-border cold-chain capabilities as produce imports from Mexico continue to rise.
The facility, located about 4.5 miles from the Pharr-Reynosa International Bridge, is designed to speed the movement of fresh produce entering the U.S. while reducing border dwell times and protecting product freshness.
“Cross-border supply chains demand speed, precision, and a tight focus on each customer’s needs,” Robinson Fresh President Jose Rossignoli said. “This South Texas facility brings those capabilities together in one place, helping customers reduce dwell time, control costs, and get products to market faster.”
The Pharr facility includes 69 dock doors, multiple temperature zones and services such as cooling, ripening, quality control, repacking and cross-dock operations. It also carries Global Food Safety Initiative and USDA Organic certifications.
Rossignoli said the facility is part of Robinson Fresh’s broader strategy of integrating sourcing, transportation and supply-chain services into a single platform for retailers and foodservice customers.
“What makes Robinson Fresh a leader in the fresh produce space is that we combine the sourcing activity with fresh supply chain activities,” Rossignoli told FreightWaves. “We provide our customers with a seamless experience — one transaction, one point of contact, one company.”
Robinson Fresh is a division of brokerage giant C.H. Robinson focused on produce and perishable supply chains. The company services grocery retailers, wholesalers and foodservice customers across North America, including companies such as Whole Foods, H-E-B, Walmart and Sysco, Rossignoli said.
Located in the town of Pharr in the Rio Grande Valley, the South Texas facility is one of the largest in the region. (Photo: Robinson Fresh)
Border infrastructure increasingly critical
According to the company, 98% of fresh produce imported from Mexico enters the U.S. through Texas, New Mexico, Arizona or California, with Texas accounting for 55% of total volumes.
The Pharr facility is strategically positioned near major transportation infrastructure, including the Pharr-Reynosa and Anzalduas international bridges, McAllen International Airport, rail connections and the ports of Brownsville and Matamoros.
Rossignoli said the Rio Grande Valley location was selected because of its importance in handling perishables moving from Mexico into the U.S.
“These facilities specifically focus on imports that come from Mexico and South America,” Rossignoli said. “We’re talking about mangoes, bananas, avocados, tropicals and limes. It requires a certain ability of repacking, quality control and consolidation.”
The logistics center represents a $33 million investment and is one of the largest facilities of its kind in the region, according to Rossignoli.
Cold-chain reliability and technology focus
Rossignoli said maintaining an uninterrupted cold chain has become increasingly important as retailers and restaurants demand fresher inventory and faster replenishment cycles.
“To have a truly uninterrupted cold chain from field to our customers, we need facilities like this one to have the best technology and infrastructure,” Rossignoli said. “That way the quality and freshness of the produce can be what our customers expect.”
The company also uses market intelligence, predictive analytics and consumer insights to help customers adapt to changing produce demand and supply-chain disruptions, he said.
Robinson Fresh operates within C.H. Robinson’s broader temperature-controlled carrier network, which includes more than 450,000 contract carriers across North America.
Rossignoli said the company expects produce imports from Mexico to continue growing as consumer demand remains strong across both retail and foodservice sectors.
“Mexico will continue to be incredibly important for Robinson Fresh and for the produce space in North America,” Rossignoli said. “We see nothing but growth, and I think this facility is going to allow us to accelerate tha
ATRI documents big jump in insurance premiums even as providers in the red
With the impact on insurance rates from Montgomery vs. Caribe Transport II suddenly a hot topic, the latest report by the American Transportation Research Institute (ATRI) has driven home the point that any increase in insurance costs is going to be added to a base that already has been soaring.
Insurance fallout from Montgomery would not necessarily hit carriers, which was the focus of the recently-released report from ATRI, the research arm of the American Trucking Associations. The 3PL industry would be the target.
That would presumably be a relief, given that virtually every number in the ATRI report released this week summarizing the insurance market over the last several years points higher.
In one of its first paragraphs, ATRI spells out some of the key figures.
Based on numbers between 2017 and 2025, which is the time span ATRI studied, the average annual increase in the commercial auto segment–which is the term for truck insurance, despite the use of the word “auto”–rose an average of 8.3%. ATRI says the U.S. inflation rate during that time was 3.9%.
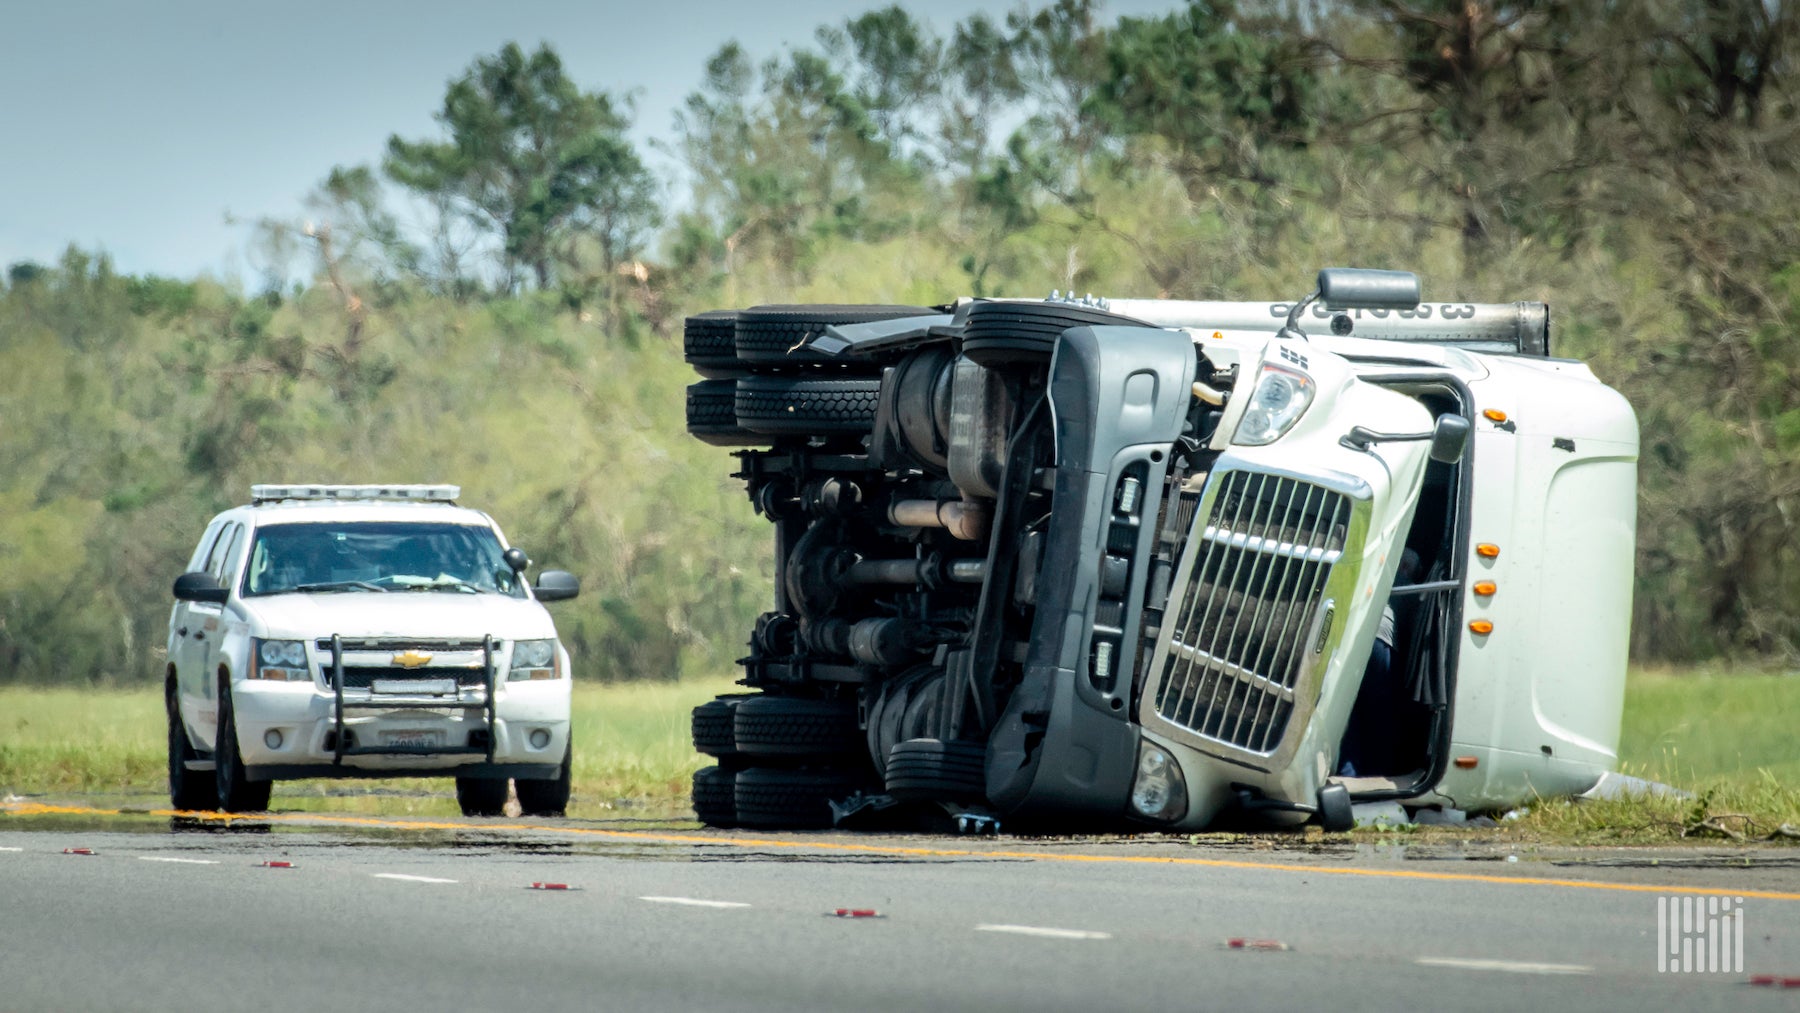
The rate of crashes with heavy-duty trucks that led to an injury or a fatality, rated per 100 million miles, declined 8.4% during that time.
The report cited a quarterly survey by the Council of Insurance Agents and Brokers that said the fourth quarter of 2025 was the “softest” quarter since 2017 for “all account sizes and the majority of lines of business.” But one sector that didn’t make that list of “soft” insurance markets was commercial auto, which the CIAB said increased sequentially by 6.6% during that quarter. CIAB said it was the highest increase of all the lines of business tracked by the group.
(A webinar on the report’s findings will be held June 2. Registration for the event can be found here.)
The increase in premiums was likely impacted by crash rates. ATRI notes that “crash rates rose over the 2010s after reaching a low-water mark in 2009 amid reduced traffic during the Great Recession.” They fell again with the collapse in traffic levels as a result of the pandemic.
ATRI produced a chart that showed in the last few years, fatal crashes have taken a turn for the better, and non-fatal crashes with injuries have been mostly steady after falling sharply during the pandemic.
But the bottom line is that crash rates, fatal or otherwise, are up since 2009.
ATRI said there were two likely causes. Citing research by the insurance ratings and research firm of AM Best, ATRI said distracted driving is a factor. Another reason: “Insurance industry analysts have also reported an influx of inexperienced truck drivers during the pandemic boom of the early 2020s as another contributor to rising claims and claim severity,” ATRI said.
Ratio on the bad side of 100
And insurance companies are not getting wealthy on the higher premiums, according to the report. Much like a trucking company operating ratio is deteriorating as it rises, what is known as the “combined ratio” for commercial auto insurance has exceeded 100, according to AM Best, every year since 2014. “meaning insurers have been continuously paying out more in claims than they collect in premiums,” ATRI said.
The one year where the ratio was less than 100 was 2021, when traffic volumes were still restrained as a result of the pandemic.
The ratio in 2023 was 109.2, improving slightly to 107.2 in 2024. “But these ratios still need a significant decrease to reach profitability,” AM Best said.
“This trend of unprofitability indicates an ongoing struggle among many insurers to accurately estimate and price the cost of risk, a problem exacerbated by the influx of new freight capacity during the COVID-19 freight boom of 2020 and 2021,” ATRI said. “In response, insurers have increased premiums not only to keep pace with their own rising costs but also to recuperate a history of losses.”
How insurers compensate
The response from insurers beyond raising rates, ATRI said, is that coverage limits have been reduced in some cases or insurers are exiting markets completely. “Both of these financial decisions exert upward pressure on rates for motor carriers, which are often forced to seek additional insurers to complete their policy stacks or retain more risk than desired,” ATRI said.
Another force driving up rates, according to ATRI: “social inflation.”
ATRI defines social inflation as “the increase in claim payouts and losses caused by social factors and societal attitudes, which raises litigation costs beyond the rate of economic inflation more generally.”
It cited the “contributors” to social inflation as “the passage of plaintiff-biased laws and regulations, changing public perception of the trucking industry or large verdicts, widespread attorney advertising, and manipulative plaintiff tactics such as those made famous by the ‘reptile theory.’”
(In a blog post, National Interstate Insurance gave an example of reptile theory in action. “According to Reptile Theory, it would be improper to say, ‘The truck driver ran the red light’, but rather ‘The trucker violated the public safety-rule to watch where he was going and obey traffic signals’”.)
A general rule in commercial auto insurance, ATRI said, is that smaller fleets pay more in insurance when based on a per-mile basis. “There are a variety of reasons for this advantage, including more consistent operations, more consistent liability loss histories, greater resources for proactively improving safety, and greater access to financial tools for managing risk, such as self-insurance,” ATRI said.
Given that fact, here’s what ATRI said fleets spend on premiums in 2024:
Fleets between 5-25 trucks: 20.3 cts/mile
26-100 trucks: 16.1 cts/mile, up 50.5% between 2020 and 2024.
101-250 trucks: 10.4 cts/mile, with what ATRI said was the “greatest stability in premium costs from 2021 to 2024.”
251-1,000 trucks: Up 43.4% from 2020 to 10.9 cts/mile.
More than 1,000 trucks: 6.6 cts/mile, but up 40.4% since 2020.
Earlier broker liability victory for Echo sent back to lower court after Montgomery
That didn’t take long.
A broker liability case won by Echo Global Logistics in 2024 on the grounds of federal preemption of state action against 3PLs has been sent back to a lower court following last week’s decision in Montgomery vs Caribe Transport II.
Echo was a defendant in a case first filed by Angela Fuelling in 2022. Her husband James was killed in early January of that year when a truck hired by Echo and operated by S&J Logistics plowed into his pickup truck while he was stopped on interstate 85 in Cherokee County, South Carolina due to a traffic backup.
Both Echo Global and S&J were sued by Angela Fuelling. But in November 2024, the federal district court for South Carolina granted Echo Global’s request for summary judgement and removed it as a defendant, citing the Federal Aviation Administration Authorization Act (F4A) as barring state action against a transportation company that could affect a “price, route or service.”
The Fuelling case threatened to be one more entry in a basket of split circuit court rulings over brokers and the so-called safety exception in F4A. The exception permits state action against a transportation company over a safety issue “with respect to motor vehicles.” Some circuits said “motor vehicles” don’t include brokerages; others said it did.
That confusion ended last week with the unanimous Montgomery decision, which held that the safety exception does include brokers and they can be held liable or negligent for their hiring decisions.
Case had been at the Fourth Circuit
Angela Fuelling had appealed the summary judgement ruling to the U.S. Court of Appeals’ Fourth Circuit. This week, with the Montgomery precedent firmly in hand, the appellate court remanded the Fuelling case back to the federal district court for South Carolina.
In the brief order, the three-judge appellate panel said “The district court’s grant of summary judgment is vacated, and the case is remanded to the district court for further proceedings in light of Montgomery v. Caribe Transp. II.”
Laying out a playbook to sue brokers
What also didn’t take long was at least one plaintiff’s attorney touting their credentials to sue brokers in the new world created by Montgomery.
In a blog post published Thursday, the Florida-based law firm of Searcy Denney Scarola Barnhart & Shipley gave a preview of how a plaintiff’s attorney might pursue in the inevitable litigation that is going to arise in a post-Montgomery world.
“A $1 million policy does not begin to compensate a client whose life has been altered forever,” the law firm said, referring to the potential upper limit a plaintiff might be able to receive from a carrier in a lawsuit. “Without a second responsible defendant, the recovery is capped far below what the case is actually worth. Montgomery changes that math.”
The blog post is not fully up to date on the state of the brokerage industry. It cites four brokers as examples, two of whom have been sold in recent years and don’t operate under their name anymore: Coyote Logistics, sold to RXO in 2024 (NYSE: RXO) and Transplace, part of Uber Freight since 2021(NYSE: UBER).
The law firm also cites C.H. Robinson (NASDAQ: CHRW) and Echo Global as examples of freight brokerages.
“In this post-Montgomery world, every catastrophic trucking case must now be screened for broker involvement at intake,” the law firm says.
Discussion post-Montgomery has often focused on brokers needing guidance on just what they will need to do to be seen as having accomplished what the law firm says is “a duty of reasonable care.”
It’s been noted in the wake of Montgomery that it may take several years for a body of law to develop enough to answer that question. But the Searcy law firm takes a stab at what it might mean. Reasonable care, the firm says, will require a brokerage to:
Review FMCSA safety ratings before hiring a carrier
Investigate carriers with “conditional” or “unsatisfactory” safety ratings
Not knowingly hire carriers with documented histories of driver-qualification failures, hours-of-service violations, or poor crash records
“A broker negligent-hiring case is not an ordinary trucking case with a new defendant,” the law firm says in its pitch to potential clients. “It is multi-defendant litigation against billion-dollar corporate defendants represented by national defense firms with seven-figure budgets. These defendants fight hard and spend freely.”
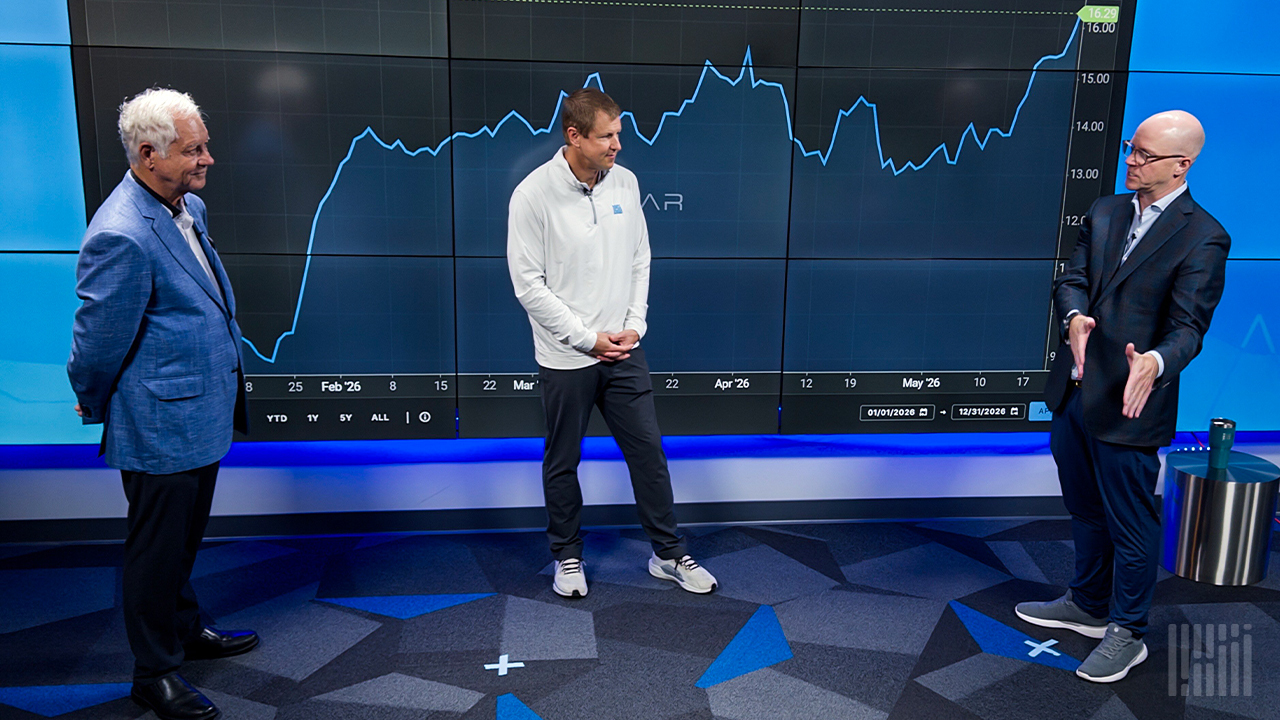
State of Freight 5 takeaways: Montgomery talk; short-term strength
Max Fuller is the founder and former CEO of U.S Xpress. Dave Bozeman is the CEO of 3PL giant C.H. Robinson.
They didn’t plan it, but on Thursday they both expressed a view of the future of the freight market in public forums that has also been heard in conversations since the Supreme Court handed down its decision on broker liability last week in Montgomery vs. Caribe Transport II.
What Max Fuller and Bozeman said out loud is that the impact of the unanimous decision might not stop with brokers. Additionally, shippers might be as affected as 3PLs by the Montgomery decision.
That was one of several topics heard in this month’s FreightWaves State of Freight webinar, with the strengthening market never far from the discussion. Here are five takeaways:
Two industry leaders see peril for shippers
FreightWaves CEO Craig Fuller brought a guest on to the State of Freight: his father Max. The company Max Fuller founded, U.S. Xpress is now part of Knight Swift (NYSE: KNX).
Max Fuller turned out to be one of two trucking executives Thursday who publicly raised the prospect that the impact from Montgomery might not be limited to just brokers. It could extend to shippers as well.
The other was Bozeman (NASDAQ: CHRW). Bozeman, appearing Thursday before the Wolfe Research transportation conference in New York, said what many people have been considering since the Supreme Court handed down its decision last week.
The argument that shippers might now find themselves liable is that the Supreme Court found that the phrase “with respect to motor vehicles” in the so-called safety exception of the Federal Aviation Administration Authorization Act (F4A) applies to brokers. The safety exception allows state action on safety issues even as F4A bars it in many other areas.
Mixed decisions from federal courts protected 3PLs in some regions of the country but not in others. With the Montgomery decision, it’s now settled that the safety exception means brokers are “with respect to motor vehicles” and state actions like lawsuits can proceed against them.
But the Supreme Court didn’t say anything about shippers. Could they be sucked into that “with respect to motor vehicles” definition under the safety exception?
“Shippers are now going to have to start looking because this particular ruling now changes the dynamic and the space of where shippers can be liable on some things.” Bozeman said according to a transcript of his remarks. “So their vetting process of brokers is going to go up.”
Max Fuller, with his background as a carrier rather than a broker, said much the same thing in the State of Freight webinar. “From what I see, they’re progressing to the point where the shipper is going to have liability, kind of like brokers,” he said. Shippers at times will use a “cheaper carrier to get a cheaper rate,” Fuller said. “They support people that aren’t being as safe as they should.”
Craig Fuller said the current strengthening market, now aided by potential fallout from Montgomery, is the “the time when the shippers say ‘we’re partners.’” But he added that a legitimate response might be “where were you two years ago when I needed to move my truck?”
“They always come up with being partners when it gets into a tough market,” Max Fuller said.
Bozeman also expressed the view that C.H. Robinson–even though it was effectively the losing party in the decision–may benefit from Montgomery’s consequences.
Shippers “(are) going to want a broker that has the strong economics and the strong service schedule to be able to have trust in where they move their goods.” Bozeman said. “And that means a lot of those kinds of smaller, less-scaled brokers will probably be hampered and come out of the system. That could be 20%, 30% of that. “
Strength into Memorial Day likely to continue
Craig Fuller and Zach Strickland, SONAR’s head of market intelligence, posted what has become a regular feature of the State of Freight webinars since late last year: a chart showing rising freight rates.
SONAR’s National Truckload Index (Linehaul only) is up to $2.64 per mile. On May 1, it was just under $2.20 per mile.
“I think this is the lowest number for what we’ll see all weekend,” Fuller said. “I think this is going to continue to rally through the weekend. I don’t see any softness coming into Memorial Day.”
Strickland noted that June tends to be the busiest month of the year in freight markets. Fuller said that was a contrast to other holidays, where there is often a “pretty significant slump” in freight demand after the celebration has passed.
“Let’s remember what happens in June,” Fuller said. “You’ve got a combination of beverages shipping, you’ve got the big construction season, you’ve got gardening, you have a lot of the summer goods and summer activities that take place.” And back-to-school shipping starts to emerge then as well, Fuller added.
“There’s no reason to think we won’t have a real bullish June,” he said.
Reason for overcapacity is becoming clear
Fuller conceded that he did not realize how much capacity was being impacted by immigrant drivers until they started to disappear from the market under the Trump administration crackdown on such issues as English language proficiency and non-domiciled CDLs.
“We didn’t realize that immigration was so pervasive and how much expansion was being caused through a lot of new entrants in the market,” Fuller said. “We now know that this was a largely oversupplied situation caused by immigrants.”
Fuller noted that he and Strickland, during the depths of the freight recession, would ask “what is keeping these trucks alive?”
“It’s very clear now that this was a labor availability and immigration-related availability that really kept a lot of new entrants in the market that was oversupplied,” Fuller said.
The market has legs…so hire some drivers
As the three presenters agreed that the strong market looks like it is here to say, Craig Fuller asked his father how he would react if was running a company now.
“I’d be trying to hire every driver I could going into this environment,” Max Fuller said. “We’ve gone through four years of a down cycle, you’re probably going to go through at least four years of an up cycle with probably premium rates that we’ve never seen before.”
With that projection, Max Fuller said, companies are probably going to start buying more trucks, “and that’s when they start hiring drivers.”
Data centers boosts demand
While Fuller and Strickland may have talked about beverages and summer equipment, Fuller said much of the increase driving demand has been from the U.S. industrial sector.
Fuller and Strickland showed the chart of the Outbound Tender Volume Index (OTVI), which measures demand. Even as some parts of the economy have been softening, like consumer packaged goods (CPGs), the OTVI continues to climb.
“What we have now is $800 million of capital spending coming into the economy through AI data center construction,” Fuller said. He added by way of comparison that construction of the interstate highway system was a $700 billion project.
The impact on demand from the data center construction “is a lot bigger factor than I think a lot of people may understand,” Fuller said.
Industrial demand “has not been participating in the market for many years,” he added. But now, “it’s going to drive us to the best year on the demand side.”
AAR slams “hypocrisy” as Trump-backed rail safety measure is included in transportation funding bill
A controversial safety measure railroads and other businesses claim will cost them billions to implement and push up consumer prices in the process will be included in the wide-ranging surface transportation reauthorization legislation.
The Railway Safety Act rode an endorsement this week from President Donald Trump as part of the Build America 250 Act that cleared the House Transportation and Infrastructure Committee on Thursday.
“Freight railroads have been clear from the beginning of the surface transportation reauthorization process: Rail policy provisions should be targeted, justified by data, and tied to clearly demonstrated operational or safety needs,” said Association of American Railroads President and Chief Officer Ian Jefferies, in a statement late Thursday. “Unfortunately, some provisions advanced today fail that test. Rather than focusing narrowly on evidence-based reforms connected to the actual causes of incidents like [the] East Palestine [hazmat derailment in 2023] , the package includes a wide range of extraneous mandates under the veil of safety that will only increase costs throughout the freight network and broader supply chain with no proven safety benefit – ultimately harming rail customers, manufacturers, energy producers, farmers and American consumers already facing significant affordability pressures.”
The RSA focuses on preventing derailments, especially those involving hazardous materials. It mandates two-person crews for freight trains, stronger inspections, better wayside defect detection, more protection for first responders, and tougher train operating standards.
Jeffries called the Act “particularly misguided” in that 2025 marked the safest year in freight rail industry history across several key safety measures, including historic lows in derailments, equipment-caused accidents, track-caused accidents, and employee injury rates.
“These gains were achieved through sustained private investment, technological innovation, and data-driven safety practices – not static federal mandates,” he said. “The Railway Safety Act, as written, violates the President’s pledge to lower costs, and is an unfortunate example that politics and special-interest pressure can sometimes usurp sound, data-driven policymaking during today’s proceedings.”
Jeffries pointed out that while the transportation bill for the first time creates a federal framework for autonomous trucks, “efforts to include rail policies that lock yesterday’s operating models into federal law are nothing more than hypocrisy.”
Broker liability ruling: Carriers, brokers, analysts weigh in
The phrase “flight to quality” was uttered often over the past week after the Supreme Court’s landmark ruling widened liability exposure for freight brokers found negligent in their driver hiring practices. While there are many unknowns, especially around future insurance coverage requirements and costs, the consensus is that the ruling will ultimately favor carriers and brokers with scale, strong financials and ample vetting procedures.
Asset-based carriers claim shippers have been migrating back to them over the past several months as the market tightened from heightened regulatory enforcement. Carriers are viewed as the only players in the space that can guarantee capacity. Large, asset-based fleets are also seen as having better driver screening protocols in place. The ruling likely places additional pressure on small fleets and owner-operators, further removing truckload capacity and pushing rates higher.
During the Wolfe Research investor conference on Thursday, Mark Rourke, president and CEO of Schneider National (NYSE: SNDR), noted that the ruling will benefit organizations with significant scale. He explained that these entities are better positioned to access insurance markets and utilize the necessary tools and vetting processes to satisfy “reasonable care” standards.
He said the company reduced its brokerage carrier network by 76% (from 60,000 to 14,000) in recent years as the pandemic brought safety and cargo security to the forefront.
“I don’t know if you can have several hundred thousand contractually approved carriers and say that you have a strong vetting process,” Rourke said.
SONAR: Outbound Tender Rejection Index (OTRI.USA) for 2026 (blue shaded area), 2025 (yellow line), 2024 (green line) and 2023 (pink line). A proxy for truck capacity, the tender rejection index shows the number of loads being rejected by carriers. Current tender rejections show a tight truckload market.To learn more about SONAR, click here.
Freight broker RXO (NYSE: RXO) views the ruling as another capacity-tightening event.
“This is an evolving situation, but the ruling is likely to have a negative impact on overall carrier capacity, as brokers will be far less likely to use a marginal carrier (i.e., one without a strong safety rating), which will push those carriers out of the industry,” the company said in its quarterly rate report issued Wednesday. “Any further reduction of the available carrier pool would contribute to increased freight rates.”
It said providers with scale, financial stability and “robust carrier onboarding processes” are better equipped to handle the changing landscape. It noted small brokers probably won’t be able to pay higher insurance premiums, likely leaving them as M&A targets.
It’s business as usual for J.B. Hunt Transport Services (NASDAQ: JBHT)—at least for now.
Appearing at the Wolfe conference on Tuesday, management said there are still several unknowns, pointing to questions around liability coverage and insurance premiums, and whether shippers will start tendering more loads to financially sound asset-based carriers and brokers. It said its third-party carrier onboarding practices are already above the industry average.
“We came to work Friday and nothing changed for us in ICS [Integrated Capacity Solutions] in terms of how we vet carriers or onboard carriers,” said Andrew Hall, senior director of finance.
Analysts favor carriers over brokers as pricing gap expected to close
The pricing gap between carriers and brokers presumably closes now that it will require more capital (higher insurance costs) to run a 3PL, analysts said following the decision.
“We believe the biggest change that this case could drive is to raise the cost to serve and ability to scale for all brokers,” said Ravi Shanker, Morgan Stanley (NYSE: MS) analyst, in a note to clients.
He said a likely outcome is that as the cost gap between brokers and asset-based fleets closes, market share could shift toward carriers since they “can offer certainty on price and availability of capacity with a smaller price gap to brokers than before.”
“We also think this improves their relative value proposition as asset-based providers,” said Deutsche Bank (NYSE: DB) analyst Richa Harnain. “We say this because if brokers look to pass along higher insurance costs, the spread between brokerage-based capacity—which is typically less expensive—and asset-based capacity should shrink.”
Analysts also said they favor carriers, as their brokerage units account for a much smaller percentage of their total revenue, minimizing the financial impact from the decision.
Landstar calling for more clarity
Broker Landstar System (NASDAQ: LSTR) touted its driver-onboarding tools and procedures, noting it has cut its independent, non-exclusive carrier network from over 100,000 in 2022 to approximately 65,000 currently.
It also called on the government to better define acceptable carrier standards.
“Landstar also believes there is an opportunity for greater clarity at the federal level regarding standards for carrier selection and qualification,” the company said in a Tuesday statement. “The Company encourages Congress, the U.S. Department of Transportation, and the FMCSA to further define expectations in this area and to evaluate current minimum financial responsibility requirements, which have not been meaningfully updated in decades.”
Georgia ports volumes hit by higher costs, softer market
Georgia’s Port of Savannah processed approximately 4.7 million twenty foot equivalent units (TEUs) for the July-April fiscal year to date, marking a 2.5% decrease, or 118,422 TEUs, compared to the previous period.
April specifically saw a significant decline, with the port handling 443,650 TEUs, off 14% from April of the previous year, when tariff-fueled frontloading turned in the busiest April on record.
“Our customers are managing through a softer market with higher operating costs,” said Georgia Ports President and Chief Executive Griff Lynch. “The Georgia Ports Authority remains focused on delivering capacity for the longer term so when the market changes, we are ready to seamlessly absorb their growth.”
The authority’s 10-year, $5 billion investment plan forecasts 54% growth. It includes the addition of five new container berths in Savannah and one new roll-on/roll-off berth in the Port of Brunswick, now the busiest gateway for automobile imports in the U.S.
Brunswick in April handled 64,305 units, an increase of 2% y/y. Heavy equipment increased by 7%. Fiscal year-to-date figures show a total of 639,574 units, an 11.8% decrease amid economic uncertainty, but total export and import volume processed of 779,000 units of automobiles and over 53,000 units of heavy machinery led all ports.
Brunswick is undergoing a series of infrastructure projects, including a new, $100 million ro/ro berth, improvements to outdoor vehicle storage, dredging, and other harbor modifications.
The GPA on May 4 opened the Gainesville Inland Port, providing direct rail service between northeast Georgia and the Port of Savannah. The $134 million project, serviced by Norfolk Southern, is projected to relocate 26,000 containers from truck to rail in its inaugural year, which will mitigate highway congestion and reduce emissions associated with a 600-mile roundtrip drive. The inland port is ultimately designed to provide an annual capacity of up to 200,000 containers.
The GPA said renovations at Savannah’s Ocean Terminal have reached the halfway completion mark. This nearly $1.6 billion project is designed to substantially increase the 200-acre facility’s annual container capacity from 200,000 TEUs to 1.75 million TEUs. GPA has already finalized the upgrade of the first of the two planned berths at Ocean Terminal. This dock space is operational for working ships and also functions as a “lay berth,” providing an optional staging area for the Garden City Terminal, enabling ships to move immediately when a berth becomes available at the main container port.
The second berth is scheduled for completion in June 2026, which will allow for two large vessels to be accommodated simultaneously. Once fully completed, the docks will span 2,800 feet. Additionally, renovations will enhance truck access and traffic flow, with the new gate structure currently 60% complete. The first components of the new gate are now open to traffic, and the full gate, featuring 12 inbound and six outbound lanes, is expected to be finished by November.
The Charcoal on That Truck Costs More to Import, More to Buy, and Is Headed to a Cookout That Runs 13% Higher Than Last Year. Here Is What That Tells You About the Consumer Right Now.
Pull up the import data on U.S. charcoal briquette shipments and you are looking at something that some people in trucking would not think to check heading into a holiday weekend. But that data, read against the consumer spending picture for Memorial Day 2026, tells you something specific about the supply chain, the retail freight market, and the household budget that is generating the loads moving this week.
The short version: charcoal shipments into the U.S. surged 95% year over year in the trailing twelve months ending May 2025. The product costs more to import than it did two years ago. The tariff environment has disrupted the supply chain of the countries that produce it. And the consumers who will burn it this weekend are paying 13% more for everything else on the table — which means the cookout is happening, but it is being funded differently than it was in 2023 or 2024.
The Import Shipment Data
Start with what the trade data actually shows.
According to Volza’s charcoal briquette import tracking, U.S. buyers imported 403 shipments of charcoal briquettes in the twelve months ending May 2025 — a 95% increase compared to the prior twelve-month period. That near-doubling of import shipment count reflects two things happening simultaneously: genuine demand recovery as the post-pandemic grilling market normalized, and front-loading behavior as importers anticipated tariff escalation and pulled inventory forward before new duties locked in. Indonesia, Paraguay, and Singapore were the top three source countries for those shipments.
Global wood charcoal exports reached $1.53 billion in 2024 according to ITC Trade Map data — up 16% from $1.32 billion in 2020, but down 3.9% from the 2023 peak of $1.59 billion. The five largest exporters by revenue in 2024 were Indonesia, Laos, Vietnam, the Philippines, and mainland China, which together captured 46.4% of global charcoal export revenues. The United States sits in the second tier of global importers by value, alongside Saudi Arabia, Germany, and the UK — with the first tier dominated by China, Japan, and South Korea absorbing the highest dollar values.
The average import price for charcoal fell to $526 per ton in 2024 — a meaningful correction from the elevated price levels of 2022 and 2023, when supply chain disruptions and logistical cost spikes pushed import prices to their recent highs. That price correction is what enabled the 95% surge in import shipment volumes: lower per-unit cost made volume purchases more attractive for U.S. importers building inventory ahead of the 2025 and 2026 grilling seasons.
Source: SONAR. NTID.USA. Spot rates are officially in COVID level territory as they soared to a new cycle high heading into the holiday weekend.
The Tariff Disruption That Is Already in the Supply Chain
Here is where the 2026 picture moves sharply from 2024 and 2025, and also where the freight implications become specific.
Indonesia is the dominant global charcoal exporter and one of the primary sources of the premium lump charcoal that has grown in market share at U.S. retail. In April 2025, the Trump administration imposed a 32% import tariff on Indonesian goods as part of the reciprocal tariff package which is up from prior rates that ranged from 0% to 5% depending on product category. That tariff did not immediately end Indonesian charcoal imports to the U.S., but it materially increased their landed cost and created sourcing uncertainty that has driven U.S. importers to evaluate alternative suppliers.
The U.S.-China tariff situation adds another layer. Charcoal imports from China, which supplies both finished product and production inputs, fell into the disrupted trade pattern that saw U.S. imports from China trend 27% lower year-to-date through late 2025 compared to 2024, with some months running 40% below prior-year volumes. For charcoal specifically, the Chinese export to U.S. is a smaller component of total supply than Indonesian or Paraguayan product, but the disruption in China-sourced supply created additional pressure on the alternative supply chains that were already absorbing the Indonesian tariff impact.
Paraguay, the second major source country for U.S. charcoal imports, faces its own trade complications. Paraguayan charcoal exports are heavily weighted toward hardwood lump product favored by the premium BBQ market, and the country’s export capacity has been shaped by deforestation regulations and bilateral trade agreements that do not include the same tariff buffers that larger trading partners negotiated. Import costs on Paraguayan charcoal have risen with the broader tariff and logistics cost environment, contributing to the per-unit price increase that retailers are managing at the shelf level.
The bottom line for the freight that moved this spring: U.S. charcoal importers front-loaded heavily through early 2025, anticipating that tariff escalation would make summer purchasing more expensive. That front-loading generated the 95% shipment volume surge in the trailing twelve months ending May 2025, and it means that the charcoal sitting on retailer shelves this Memorial Day weekend largely arrived months ago, before the most aggressive tariff rates took effect. What arrives for the Fourth of July and Labor Day seasons will cost more at the import level if supply chains have not been restructured in the interim.
What the Consumer Sees at the Store
The import data describes one end of the supply chain. The retail price data describes what landed when the chain is complete, and the 2026 picture at the consumer level is significantly more expensive than the 2024 baseline.
Barbecue staples like burgers, hot dogs, watermelon, and core cookout goods, are up an average of 13% in 2026 compared to last year, according to a Groundwork Collaborative and Century Foundation analysis published this week. Six ears of yellow corn average $5.90 today versus $2.97 last year which is a 98% increase driven by weather-related production disruptions and commodity cost pressures that have nothing to do with charcoal but everything to do with the household budget available for the cookout.
Rabobank’s BBQ Index puts the current cost of a Memorial Day cookout for ten people, one cheeseburger and one chicken sandwich each, at approximately $103, up from $73 in 2018. The cumulative seven-year increase in cookout cost is not primarily a tariff story. Over 90% of U.S. barbecue ingredients are domestic. It is an input cost, supply constraint, and logistics cost story that has been building across the entire food supply chain and it is now visible on every receipt at every grocery checkout between here and Memorial Day.
The Kingsford Earnings Timeline: The Closest Thing to a Real-Time Grilling Gauge
Kingsford holds the dominant share of the U.S. charcoal briquette market by a significant margin which means Clorox’s quarterly earnings reports are as close to a real-time read on American grilling behavior as any public data source provides. The arc of those results across the past four reporting periods tells a specific and consistent story.
Clorox’s fiscal year runs July through June, which means Q4 (the quarter ending June 30) captures the peak of grilling season including Memorial Day and the Fourth of July. That quarter historically generates roughly 50% of annual Kingsford revenue. It is the most important data point in the brand’s calendar.
In Q3 fiscal year 2025 (the quarter ending March 2025), Clorox reported that the Household segment, which includes Kingsford under Bags and Wraps, Cat Litter, and Grilling also saw net sales decrease 11%, driven by 9 points of lower volume and 2 points of unfavorable price mix. The specific call-out in the earnings release: lower Kingsford volume was driven by lower consumption, a timing shift in Kingsford shipments, and retailer promotional timing adjustments. That is a company describing a demand environment where consumers are grilling less frequently than the prior year and retailers are being cautious about inventory builds heading into the peak season.
Moving into fiscal year 2026, Q1 (ending September 2025) saw Clorox overall organic sales decline 3% with Kingsford contributing to weakness in the Household segment. Q2 fiscal 2026 (ending December 2025) showed the Household segment down 6%, 3 points from lower volume, 3 points from unfavorable price mix and with the volume decrease attributed specifically to lower consumption. The full fiscal year 2026 outlook Clorox confirmed in February projects net sales down 6% to 10%, partly reflecting the reversal of those ERP-related shipment benefits that inflated the prior year’s numbers.
Read together, these four quarters paint a specific picture for anyone trying to understand what moves through a charcoal distribution network heading into Memorial Day 2026. The domestic consumer charcoal market is operating below its pandemic peak, below its post-cyberattack recovery high, and in a promotional environment where retailers are discounting aggressively to drive volume rather than waiting for organic demand to pull product off the shelf. The consumer is there. The frequency and basket size of each grilling occasion has compressed. Smaller package sizes are gaining share over large format. And Kingsford — the brand that essentially is the U.S. retail charcoal market — has publicly acknowledged that execution at the holiday level is where the battle is being fought, not at the level of underlying category demand.
The Memorial Day promotional pricing visible at retail this weekend. Wayfair at up to 83% off grills, twin-pack charcoal deals at Home Depot and Lowe’s is the retail expression of everything Clorox’s earnings data shows at the manufacturer level. Retailers compete hard for a consumer who is present but price-sensitive. The promotional depth required to move product is itself a signal about the demand environment, and in 2026 that depth is meaningful.
What the Freight Pattern Actually Looks Like
Charcoal is not a complicated freight profile, but understanding it specifically is useful for carriers in the corridors where it moves.
Domestic charcoal production Kingsford’s plants in Kentucky and West Virginia, Royal Oak’s operations in the South and Midwest, and smaller regional producers generates the majority of retail charcoal volume. This domestic product moves from manufacturing through regional DCs to retail in standard dry van or flatbed depending on pallet configuration. The movement is concentrated in a compressed window: the eight to ten weeks from late April through early July, with Memorial Day as the demand apex.
Imported charcoal enters through East Coast, Gulf Coast, and West Coast ports depending on source country. Indonesian and Vietnamese product typically enters through West Coast ports, while Paraguayan and South American hardwood product moves through Gulf and East Coast facilities. From the port, it flows to regional importers and distributors often smaller specialty operations serving the premium lump charcoal segment at retail and food service before moving to retail via short-haul regional lanes.
For carriers operating near retail distribution centers in the Southeast, Mid-Atlantic, and Midwest, the pre-Memorial Day charcoal replenishment window is already largely complete. The freight that supports this weekend’s cookouts moved two to three weeks ago. The next opportunity in this product category is the Fourth of July replenishment cycle, which begins in mid-June for major retailers and represents the second-largest charcoal sales event of the year.
The import disruption from tariffs on Indonesian product and the front-loading behavior of 2024 and early 2025 means that the Fourth of July and Labor Day replenishment cycles may look different from prior years — either with tighter inventory positions driving urgent spot replenishment freight, or with excess inventory from the front-loaded purchases suppressing new orders. Both scenarios generate different freight profiles and neither is yet determinable from the available data.
What the Cookout Tells You About the Freight Market Broadly
The Memorial Day data point is a snapshot of something larger: a consumer who is still participating in the traditions that generate retail freight, but who is making increasingly specific decisions about what to buy, what to substitute, and what to skip.
USDA projects total U.S. beef consumption will reach 29.38 billion pounds in 2026 up 1.3% from 2025 and 7.7% above 2019 levels. Meat Institute data shows meat sales hit a record $112 billion in 2025. People are still buying meat. The demand is genuine. But the consumer who is paying $9.64 per pound for beef and $5.90 for six ears of corn is making trade-offs at the shelf level that shift the mix of what moves through the freight system.
Chicken is gaining share against beef at the cookout as consumers manage cost without abandoning the grill occasion. Pork is benefiting similarly. Charcoal briquettes at standard price points are moving; premium lump charcoal at higher retail prices is facing more resistance. Grill hardware sales, after years of post-pandemic correction, are showing early stabilization but require promotional pricing to move at volume.
For carriers serving food distribution and retail replenishment lanes, the volume is present and the product mix is shifting within categories. For carriers serving home improvement retail on the grill and outdoor goods side, the promotional depth this weekend is the most direct read available on whether the consumer durable correction has found its floor. For every carrier running any lane that touches retail freight — the charcoal, the beef, the chicken, the condiments, the bags of ice the cookout happening in backyards across the country this weekend is the downstream demand that justifies every load in the system right now.
The grill is lit. The freight chain that made it possible started at a port, ran through a DC, and ended at a dock. That chain is more expensive to operate in 2026 than it was in 2024. The consumer is absorbing that cost for now.