First Look: Universal Logistics Holdings

Universal Logistics Holdings Inc. reported second quarter revenue of $393.8 million, a 15% year-over-year decrease.

The company’s adjusted earnings per share decreased 73% year-over-year to 32 cents during the quarter.

Universal Logistics (Nasdaq: ULH) is a Warren, Michigan-based truckload transportation, intermodal and logistics provider. The company provides services across the U.S, Mexico, Canada and Colombia and has more than 10,000 employees.

The company missed Wall Street analysts’ forecasts for revenue of $398.5 million and earnings per share of 34 cents in the second quarter.

“Universal’s results for the second quarter, although muted, were broadly in-line with our previously guided expectations,” Tim Phillips, Universal’s CEO, said in a news release. “As we continue to navigate a persistently weak freight backdrop, we remain committed to delivering exceptional service to our customers and making strategic investments to drive our long-term growth initiatives.”

The trucking segment saw a 29.9% year-over-year decrease in second quarter revenue at $45.9 million. 

On a year-over-year basis, trucking load volumes declined 22.6%, and the average operating revenue per load, excluding fuel surcharges, declined 8.9% to $1,927.

In the contract logistics segment, which includes Universal’s value-added and dedicated services, operating revenues decreased 1.1% year-over-year to $260.6 million.

“At the end of the second quarter 2025, we managed 87 value-added programs, including 20 rail terminal operations compared to a total of 68 programs at the end of the second quarter 2024,” the company said.

Revenue in the intermodal segment decreased 13.5% year-over-year in the second quarter to $68.9 million. Load volumes declined 12.9%, while the average operating revenue per load, excluding fuel surcharges, was $556.

Universal Logistics announced a cash dividend of 10.5 cents per share of common stock. The dividend is payable to shareholders of record by Oct. 1.

The company will hold a conference call to discuss results with analysts at 10 a.m. Friday.

Universal Logistics HoldingsQ2/25Q2/24Y/Y % Change
Revenue$393.8M$462.2M(15%)
Trucking revenue$45.9M$66.8M(31%)
Brokerage services revenue$19.6M$53.7M(64%)
Intermodal revenue$68.9M$78.1M(13.5%)
Contract logistics segment$260.6M$263.6M(1.1%)
Adjusted earnings per share$0.32$1.17(73%)

Universal Logistics key second quarter performance indicators.

Trump pick grilled on supply chain strategy

WASHINGTON — Senate lawmakers grilled the Trump administration’s likely point person for the nation’s freight markets on his strategy for keeping ahead of the next supply chain disruption.

Michael Rutherford, the administration’s pick to head the Office of Multimodal Freight Infrastructure & Policy at the U.S. Department of Transportation, testified at his nomination hearing that Freight Logistics Optimization Works (FLOW), DOT’s freight data exchange portal, will him and his staff do that.

“Supply chain visibility is everything,” Rutherford told the Senate Commerce Committee on Wednesday. “I like to describe transportation as being an outdoor sport – you have to be able to change as the operating environment changes. That forward-looking visibility that FLOW provides I think is incredibly helpful, and we have a great base from which to build.”

FLOW was created by the Biden administration in March 2022 in response to pandemic-related backups radiating out from U.S. ports clogged with container ships as importers struggled to keep up with a surge in freight demand in the second half of 2021.

The portal compiles purchase order and billing data shared voluntarily by importers, railroads, trucking companies, ports, warehouses and logistics companies to build an advance freight-flow forecast to flag congestion buildups in the supply chain that can be mitigated before they get out of hand.

Starting with an initial 18 companies providing freight data when it was launched three years ago, FLOW now has 86 members participating in the public-private partnership, including big-box importers Walmart (NYSE: WMT), Target (NYSE: TGT), and The Home Depot (NYSE: HD).

“Despite early successes, there is still so much more the freight office can do to build upon earlier efforts and I look forward to exploring the opportunities,” Rutherford told the committee.

CSX experience

A former railroad executive, Rutherford joined CSX in 2008, “ultimately managing everything moving on the railroad except intermodal and coal,” he told the committee, helping customers during the roll out of the railroad’s Precision Scheduled Railroading [PSR] initiative.

He said that experience will come into play in helping his office develop the National Multimodal Freight Network (NMFN), a federally designated network of highways, railways, seaports, and airports. DOT, under the Biden administration, published a draft NMFN interactive map in January.

“One of the objectives of the freight office is to address issues of congestion, which is the enemy of asset utilization,” Rutherford said. “When we fix problems of congestion, you’re not just driving down cost but you’re actually generating additional capacity, so that you can also be more efficient. We saw that at CSX with the rollout of [PSR]. It becomes a virtuous cycle.

“By working with the multimodal freight network and identifying key strategic infrastructure, we’ll be able to make certain that we’re focusing our emphasis on improving our overall infrastructure, where it matters most for both shippers and transportation providers.”

Rutherford promised that, if confirmed, finalizing the NMFN, which will be used to help states direct and prioritize infrastructure project funding, will be “a priority on Day One,” and he will use it to develop a broader National Freight Strategic Plan.

DOT recently opened a docket for public comments to help update the plan, which was issued in 2020 during the first Trump administration. Comments are due Aug. 14.

Click for more FreightWaves articles by John Gallagher.

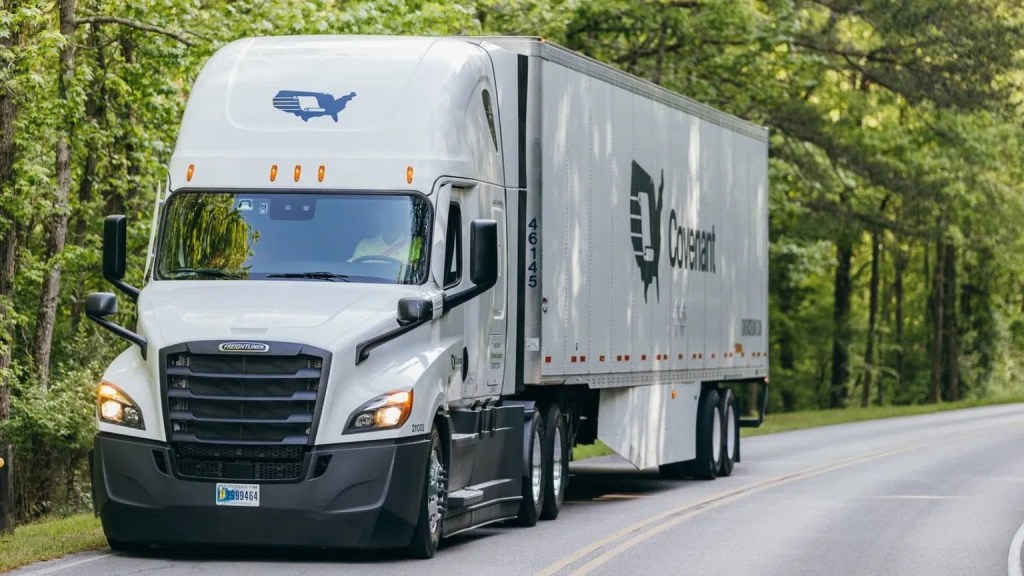
Covenant Logistics sees potential freight market improvement in October

Covenant Logistics Group Inc. officials said a reduction in interest rates could inject momentum into home sales across the country and help revive the broader freight market.

Chattanooga, Tennessee-based Covenant (NASDAQ: CVLG) reported second-quarter earnings after the market closed Wednesday. Company officials held a conference call to discuss the results with analysts on Thursday.

“I was with housing folks yesterday … in the floor covering business, and they’re just basically waiting for interest rates to drop in the housing [market]. They think the backlog is gigantic as soon as people can afford the payments,” Covenant Chairman and CEO David R. Parker said.

“We see the battle going on in Washington with the Federal Reserve on the interest rate, and I think that is a catalyst because [President Donald Trump] will win. Whether that’s in November, October, or next March, he’s going to win that battle, and those interest rates are going to go down, and housing is going to improve.”

Parker said the housing market is a big part of the trucking industry.

“It’s just a big nucleus of freight for the housing industry. The better the economy, the more freight that’s going to be available for all of us,” Parker said.

Covenant Logistics Group’s freight revenue rose 7.8% year-over-year in the second-quarter to $276.5 million, a quarterly record. 

The company’s total revenue rose 5% year-over-year to $302.85 million. Adjusted earnings per share was 45 cents in the quarter, compared to 52 cents in the same year-ago quarter.

Covenant Logistics exceeded Wall Street’s earnings per share and revenue forecasts for the quarter at $0.419 and $287.25 million.

Tripp Grant, executive vice president, said revenue rebounded during the second quarter due factors such as growing the company’s dedicated fleet, new business in managed freight, a small acquisition and receding impact of weather and avian influenza.

Covenant Logistics expedited segment posted second-quarter freight revenue of $83.2 million, a year-over-year decrease of 6.4%. Average total tractors decreased by 50 units, or 5.5%, to 860, compared to 910 in the prior year quarter. 

The company’s expedited average freight revenue per tractor per week decreased 1% year-over-year to $7,442.

“Our expedited segment yielded a 93.9 adjusted operating ratio, a result only slightly better than the year ago quarter,” Grant said. “While this result falls short of our expectations for this segment, we were pleased with the year over year consistency.”

For the quarter, freight revenue in the company’s dedicated segment was $90.2 million, 10.2% year-over-year increase. Average total tractors increased by 162 units, or 11.7%, to 1,546.

Covenant Logistics average freight revenue per tractor per week in its dedicated segment decreased 1.4% year-over-year to $4,486, partially offset by a 7% year-over-year increase in freight revenue per total mile at $3.06.

Covenant’s managed freight segment saw revenue of $77.5 million in the second quarter, an increase of 28% from the same time last year. The warehousing segment had revenue of $25.5 million during the quarter, a 1% year-over-year gain.

“Our baseline expectations for the second half of the year includes additional start ups in our dedicated segment, a slowly improving general freight market and modest peak season that will benefit expedited and dedicated, and a wide range of outcomes in managed freight,” Grant said.

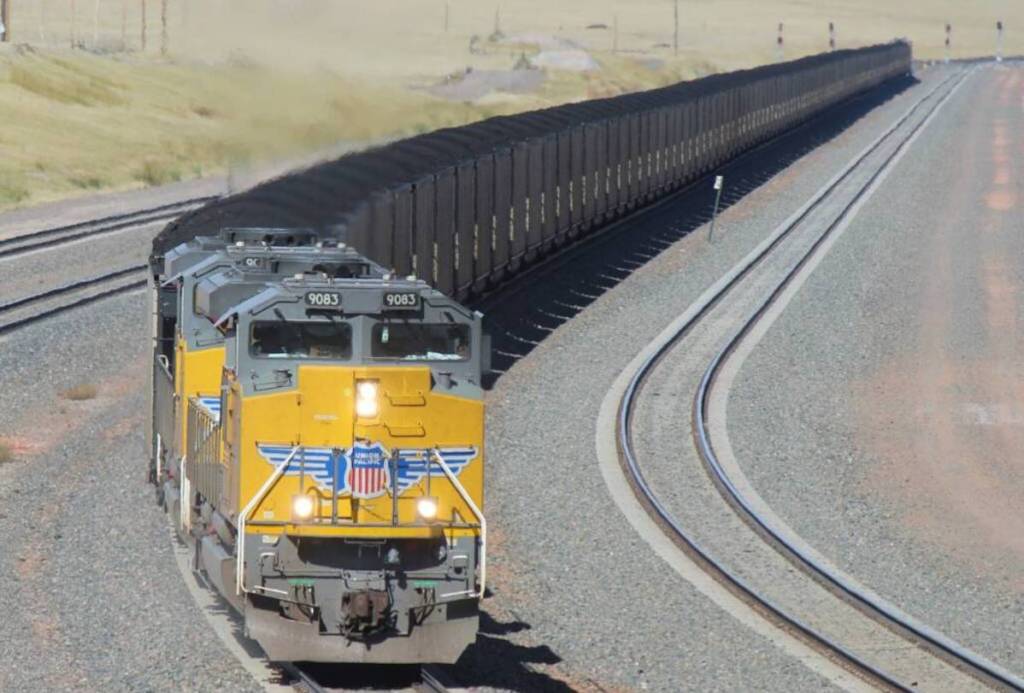
Union Pacific posts record financial results

Union Pacific (NYSE: UNP) reported record second quarter financial results this morning as surging coal volumes led the railroad’s traffic gains.

“We are delivering on our strategy and our results demonstrate our commitment to leading the industry as we set new standards for safety, service, and operational excellence,” Chief Executive Jim Vena told investors and analysts on the railroad’s Thursday morning earnings call.

The railroad’s operating income increased 5%, to $2.5 billion, as revenue grew 2%, to $6.2 billion. Earnings per share rose 15%, to $3.15. The operating ratio was 59%, a 1-point improvement from a year ago.

Overall volume increased 4%, with growth across all three of the railroad’s business segments. Intermodal was up 1%, industrial products 3%, and bulk 11%, driven by a 31% increase in coal volumes.

Favorable natural gas prices and the start of service to the Sam Seymour Power Plant in La Grange, Texas, propelled the spike in coal volume, said Kenny Rocker, executive vice president of marketing and sales. BNSF previously held the power plant coal contract.

UP’s key operational and service metrics all improved for the quarter.

Velocity, measured by car miles per day, increased 10% to 221 thanks to lower dwell and higher average train speeds. Train length was up 2%, locomotive productivity 5%, and workforce productivity by 9% to a new record. The railroad’s injury and accident rates dropped for the quarter, although UP did not release precise figures.

Intermodal trip-plan compliance rose 5 points to 88%, while merchandise trip-plan compliance improved 10 points, to 74%.

“Our agility was once again on full display as we effectively handled a 30% surge in coal and renewable shipments, all while providing the service we sold our customers,” said Eric Gehringer, executive vice president of operations. “Ultimately, it’s another proof statement highlighting our robust and reliable service product, which is imperative as we strive to grow with our existing customers and unlock new markets.”

The company affirmed its financial outlook for the year despite ongoing economic uncertainty surrounding tariffs and trade policy and the strength of consumer spending.

“​​We expect coal volumes to significantly exceed last year’s levels,” Rocker said. The railroad also has a positive outlook on its industrial products business, due in part to new and expanded facilities coming on line on the Gulf Coast. Intermodal volumes are expected to be weaker than last year’s second half, when the railroad saw a tariff-driven surge in international volume from West Coast ports.

Subscribe to FreightWaves’ Rail e-newsletter and get the latest insights on rail freight right in your inbox.

Related coverage:

Five takeaways from the State of Freight for July: What earnings and the indices are saying about the market

Union Pacific and Norfolk Southern confirm advanced merger talks

CSX profits fall on lower revenue, higher costs

First look: Weaker coal, carloads hit CSX earnings 

Alaska Airlines gains cargo momentum from Hawaiian integration

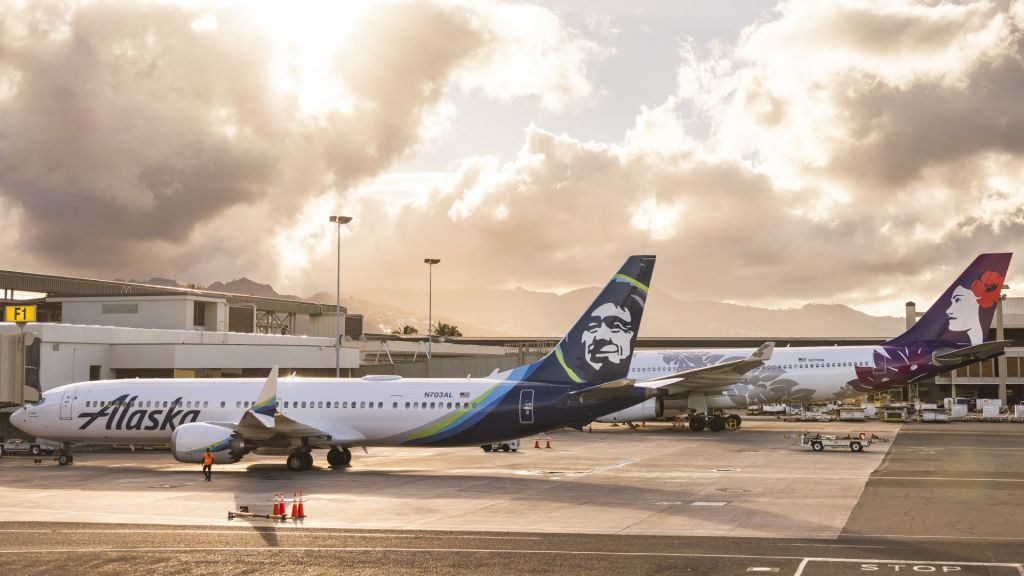
Alaska Airlines plane with a blue tail and Eskimo face painted sits beside a Hawaiian Airlines jet at an airport with a mix of sun and clouds.

Alaska Airlines has already surpassed initial cargo volume targets since launching its first international widebody service, from Seattle to Tokyo Narita airport, on May 12 as the company continues to reap the fruits of its September merger with Hawaiian Airlines, executives said Thursday during a quarterly earnings presentation.

Alaska Air (NASDAQ: ALK) is operating daily nonstop service to Tokyo with Airbus A330 passenger jets from Hawaiian’s fleet. Carrying cargo in the lower deck is driving the equivalent of 30 passenger seats worth of revenue per flight, according to management. Alaska will cover the route with Boeing 787-9 aircraft, starting in January, a spokesperson said via email.

The Alaska Air Group reported $136 million in cargo revenue during the second quarter, a 34% increase from the same period in 2024. The revenue gains include the Alaska Airlines, Hawaiian Airlines and Amazon cargo lines of business as compared to those three business units before the merger. 

Legacy Alaska Air Cargo second-quarter revenue increased 15% to $80 million. 

The carrier has effectively backfilled most of the cargo volume displaced by repositioning the 787s from Honolulu to Seattle, according to the company. 

Meanwhile, Alaska brought into service the final two of 10 Airbus A330 converted freighters operating under contract with Amazon to support its package delivery network. The Amazon business was inherited from Hawaiian Airlines, which began flying for the online retailer in late 2023. Alaska Airlines and Amazon are both based in Seattle.

The acquisition of Hawaiian Airlines for $1.9 billion gave Alaska Airlines access to widebody aircraft for the first time and more cargo capacity on domestic and international routes. In the nine months since Alaska Airlines combined with Hawaiian Airlines, the air cargo teams have worked to integrate their operations and systems, and improve processes for customers shipping to more than 130 cargo destinations.  

“We’re bullish on where we can go with this as we combine the two networks,” said Jason Berry, who heads Alaska’s cargo business and also serves as president of regional subsidiary Horizon Air.

Alaska will begin passenger and cargo service from the Seattle gateway to Seoul, South Korea, on Sept. 12 and launch its first transatlantic route to Rome next May.

Alaska Air Cargo in late March introduced sharing booking across the combined Alaska and Hawaiian cargo network. Shipments that originate on Alaska Air and continue on Hawaiian Airlines, or vice versa, can now be booked and tracked by customers on a single air waybill. Alaska is also working to co-locate cargo operations at stations served by both Alaska and Hawaiian, allowing customers to pick up and drop off shipments at a single location. Stations at New York JFK and Seattle, for example, were combined in early this year, according to company announcements. 

Three of six daily nonstop flights between Seattle and Honolulu now operate with Airbus A330 Hawaiian widebody jets, offering increased cargo capacity. Alaska Airlines has also increased capacity for the Alaska fishing season  — which runs from June 12 until Aug. 15 — by deploying A330 aircraft between Seattle and Anchorage twice daily to take advantage of the aircraft’s larger belly hold. 

Overall, Alaska Air beat analysts’ expectations on the top and bottom lines, with revenue of $3.7 billion (up 2.1%) and earnings per share of $1.78 versus a consensus prediction of $1.44. Solid demand, especially in the premium segment, 

CEO Ben Minicucci noted that the Hawaiian Airlines segment produced a quarterly profit for the first time since 2019, underscoring the power of combining the two carriers. Repositioning more A330 passenger jets to fly from Seattle to Honolulu and Anchorage has maximized asset utilization and improved the bottom line, he said. 

(Correction: An earlier version of this story incorrectly described the type of aircraft Alaska is flying to Tokyo. It is an Airbus A330.)

Click here for more FreightWaves/American Shipper stories by Eric Kulisch.

Boeing raises outlook for widebody freighters as 777-8 production begins

Alaska Air changes cargo leaders in wake of Hawaiian merger

How to Build a Preventive Maintenance Calendar That Actually Gets Used

Too many small carriers run their maintenance programs off hope and memory. And let’s be honest—that’s not a strategy. That’s a liability.

Waiting until something breaks costs more than just money. It costs downtime, lost loads, and sometimes even your reputation. The worst part? Most of it’s avoidable. The problem isn’t that fleets don’t believe in preventive maintenance—it’s that they don’t have a system that gets followed, week after week, month after month.

This article is not about building a pretty spreadsheet or buying fancy software. It’s about building a preventive maintenance calendar that works in the real world. One that keeps trucks moving, drivers safe, and your business out of trouble.

Let’s break it down.

Step 1 – Know Your Maintenance Intervals Like You Know Your Fuel Price

Every truck in your fleet has manufacturer-recommended maintenance intervals. But real-world trucking doesn’t always match the manual.

Don’t rely solely on OEM schedules. Instead, build a baseline schedule around (example below):

  • Oil and filter changes every 15,000 to 25,000 miles, depending on engine type
  • Tire rotations and inspections every 50,000 miles
  • Brake inspections every 3 months
  • DOT-level inspections every quarter
  • Full PM service (fluids, belts, hoses, filters) every 25,000 to 30,000 miles
  • Reefer unit service every 600 hours (if applicable)

Match these intervals to actual mileage and usage data from your ELDs or telematics. If you’re not already tracking these, you’re flying blind.

Step 2 – Create a Rolling 12-Month Calendar, Not a “Set It and Forget It” Plan

Most fleets fail here.

They print out a maintenance schedule in January, then never update it again. By March, it’s already off track. Trucks move. Loads change. Breakdowns happen.

Instead, build a rolling calendar that updates every month. Here’s how:

  1. Start with your truck list—unit numbers, VINs, current mileage, and last PM date
  2. Plug in due dates for each major service type
  3. Assign windows, not hard dates. For example, “Week of July 8” instead of “July 10”
  4. Review monthly during your operations or dispatch meetings
  5. Adjust based on usage—if a truck ran heavy miles this month, move its PM up

This way, your calendar stays alive. You’re not guessing or reacting. You’re planning and adjusting.

Step 3 – Make It Visual and Accessible

If your maintenance schedule lives on one person’s desktop, it’s already failing.

Your calendar needs to be visual, shared, and accessible to your entire ops and dispatch team. Not just the mechanic. Not just the owner.

Use something your team already checks—like:

  • A shared Google Calendar with color-coded events by truck
  • A Trello board with cards for each unit
  • Your TMS, if it supports maintenance workflows
  • Even a whiteboard in the shop if you’re still running lean

Each truck should have a visible service window. If a unit’s PM is coming up next week, your dispatcher should already be planning to rotate it out. If it’s overdue, there’s no excuse—everyone should see it.

Step 4 – Tie Preventive Maintenance to Dispatch and Driver Pay

Want to make sure your PM calendar actually gets used?

Tie it to your dispatch process.

No truck should be booked on a multi-day load if it’s due for service in two days. Period.

Train your dispatcher to check the calendar before booking. Build PM windows into the load plan. A truck in for maintenance isn’t “down”—it’s being protected.

Better yet, tie it to driver performance.

Drivers should complete post-trip inspections that feed into your PM calendar. If they’re consistently submitting DVIRs and helping you spot issues early, that’s worth tracking—and rewarding.

And if they’re ignoring warning signs or skipping reports, you need to know that too. Maintenance is a team sport. Everyone’s got a role to play.

Step 5 – Log Everything, From the First Oil Change to the Last Tire Recap

It’s not preventive maintenance if you can’t prove it.

Create a log for every unit. Track:

  • Service dates
  • Mileage/hours at service
  • What was performed
  • Who did the work (in-house or vendor)
  • Cost of service

Use this data to spot trends. Is one truck eating brakes every 50K miles? Is another constantly blowing hoses? Patterns tell stories—and let you plan better.

If the DOT walks in or you go through an audit, having clean, complete maintenance records shows you’re serious about safety. That’s a competitive advantage in this market.

Step 6 – Schedule Reviews Like You Schedule Oil Changes

The final piece is accountability.

Every month, review your PM calendar. Ask:

  • What got done?
  • What got missed?
  • Why was it missed?
  • What trucks are coming due next month?

These reviews don’t need to be long. 15 minutes in your weekly ops meeting is enough. But they must happen.

Treat your PM program like a load that needs to be delivered on time. Because in a way, it is.

Real-World Example – TTN Joins The Long Haul to Discuss Maintenance

@Fleet Maintenance, DPF Nightmares & Towing Scams: What Every Small Carrier Needs to Know

Final Word

Preventive maintenance isn’t just about avoiding repairs. It’s about running a business that’s built to last.

When you build a PM calendar that’s visible, flexible, and tied to dispatch, you don’t just protect your trucks—you protect your reputation, your bottom line, and your ability to grow.

Start small. Start simple. But start now.

One truck. One calendar. One system that gets used.

That’s how strong fleets stay in the game.

Roadrunner adds over 100 lanes, establishes Kansas City hub

A gold Roadrunner sleeper cab pulling a white Roadrunner trailer

Less-than-truckload carrier Roadrunner announced Thursday it has added more than 100 lanes and established Kansas City as a major hub in its network.

All major geographical regions of the U.S. saw lane additions, with the industrial-oriented Midwest experiencing the most significant expansion. Roadrunner said most key markets in the Midwest now have direct service into its new Kansas City hub.

Roadrunner (OTC: RRTS) also improved network connectivity between locations in the Northeastern, Southern and Western U.S. to the interior of the country.

“The addition of new lanes into our Smart Network speaks volumes about the level of service we’re delivering,” said Tomasz Jamroz, president and chief operating officer, in a news release. “This expansion moves us closer to our goal of becoming the preeminent long-haul LTL carrier in the country.”

Jamroz said the company recently logged a fourth straight month of record gains in its service metrics.

Roadrunner also expanded its guaranteed service offering, adding more than 21,000 miles of coverage in the U.S. and Canada. New guaranteed lanes include: Houston-to-Atlanta, Philadelphia-to-Dallas, Seattle-to-Dallas, San Francisco-to-Chicago, as well as certain originations from Commerce, California and Milwaukee.

The carrier now has more than 60 guaranteed lanes.

“Our commitment to a direct-run Smart Network gives shippers more control and reliability —especially as others in the market contract,” said Shari Leon, vice president of linehaul operations at Roadrunner. Leon said the expanded service is improving transit times and reducing shipment handoffs, which minimizes damages.

“This scale-up into high-demand cities showcases the power of our over-the-road model and precision linehaul planning,” Leon said.

The company added 278 lanes to its direct metro-to-metro, long-haul network in March.

Roadrunner provides a national LTL service footprint through a network of more than 40 terminals and over 1,000 independent drivers.

More FreightWaves articles by Todd Maiden:

NATO warns ports vulnerable to ‘unprecedented’ cyber threats

A new report from NATO’s Cooperative Cyber Defence Centre of Excellence (CCDCOE) warns that global ports are vulnerable in the wake of escalating cyber threats. 

The policy brief highlights that ports, which handle approximately 80% of international trade, “face unprecedented cybersecurity threats from state-linked actors” from Russia, Iran, and China. These actors aim to disrupt operations and potentially inflict significant economic and military harm.

Ports serve as crucial nodes in NATO’s defense logistics network, and recent intelligence reveals a high frequency of cyber attacks on port facilities across Europe and the Mediterranean. A significant proportion of these cyber assaults have been traced back to threat actors originating from Russia, Iran, and China. These nations are allegedly leveraging cyber tools to achieve broader geopolitical objectives by deploying sophisticated and often coordinated cyber campaigns against critical infrastructures.

The report outlines that the nature of these cyber threats is both sophisticated and pervasive. It stresses the pressing need for coordinated policy and security responses to counteract these risks. Cyber attacks have predominantly targeted access control systems and vessel traffic management systems, which are essential for maintaining the smooth operation and safety of port facilities. Such vulnerabilities, if exploited, could lead to severe disruptions in global supply chains and critical military logistics operations.

The vector for these threats expands beyond simple hacking attempts or malware. The CCDCOE identifies the involvement of politically-motivated hacktivists, particularly pro-Russian groups like NoName057. These groups, employing methods such as distributed denial-of-service (DDoS) attacks, have effectively demonstrated the disruptive potential of cyber operations. For instance, one notable incident involved NoName057’s disruption of the Port of Rotterdam’s main website in June 2023, underscoring the group’s ability to impact port operations directly. The group also attacked the ports of Gdynia in Poland, and Felixstowe and Tyne in Great Britain.

The report also cited maritime organizations, logistics providers, and air traffic control systems in at least 11 countries that were targeted by a group linked to Russian military intelligence services.

In Israel, the ports of Ashdod and Haifa and an oil refinery, and Egypt’s Port Said, were attacked by Iran-based groups. 

Maritime transportation companies were targeted by China-connected groups using various attack vectors, including infected USB drives.

NATO said at least 45 maritime organizations suffered ransomware attacks in 2024.

The challenge extends further to state-sponsored cyber attacks, notably from Iranian groups under the aegis of the Islamic Revolutionary Guard Corps and China’s increasing pre-positioning of cyber tools on critical infrastructure networks. These actions provide these states with the capabilities to execute disruptive or even destructive cyberattacks, posing a direct threat not only to the economic fabric of affected countries but also to their national security.

NATO’s current maritime strategy, last revised in 2011, is critiqued in the report for lacking formalized frameworks for engagement with commercial port operators. Because critical port infrastructures are predominantly under civilian control yet serve essential military logistics functions, updated strategies are required that integrate cybersecurity measures tailored to address the needs of modern-day maritime operations.

There are several recommendations from the CCDCOE aimed at enhancing the cyber resilience of maritime ports. These include the need for establishing sector-specific intelligence sharing networks, coordinated response mechanisms, and resilience standards. Such measures would facilitate better cooperation between public and private entities while bolstering NATO’s maritime cyber defense posture.

The cost of inaction, according to the CCDCOE, far exceeds the investment necessary for comprehensive maritime cybersecurity. Without a fortified approach, ports remain susceptible to cyber incursions that could disrupt global trade, endanger economic stability, and compromise national security. The report calls for an urgent revision of existing cybersecurity frameworks to incorporate these recommendations, fostering an environment where intelligence sharing, strategic coordination, and robust cybersecurity practices become the norm.

Find more articles by Stuart Chirls here.

Related coverage:

Historic order for U.S.-built LNG carrier could test new rules 

Trans-Pacific shippers’ turn to pause as box rates end slide

“It all unraveled quickly”: Family-owned business laments tariff and trade chaos

Drewry: Ocean rates fall for fifth straight week

DOT ignores air cargo infrastructure needs, study says

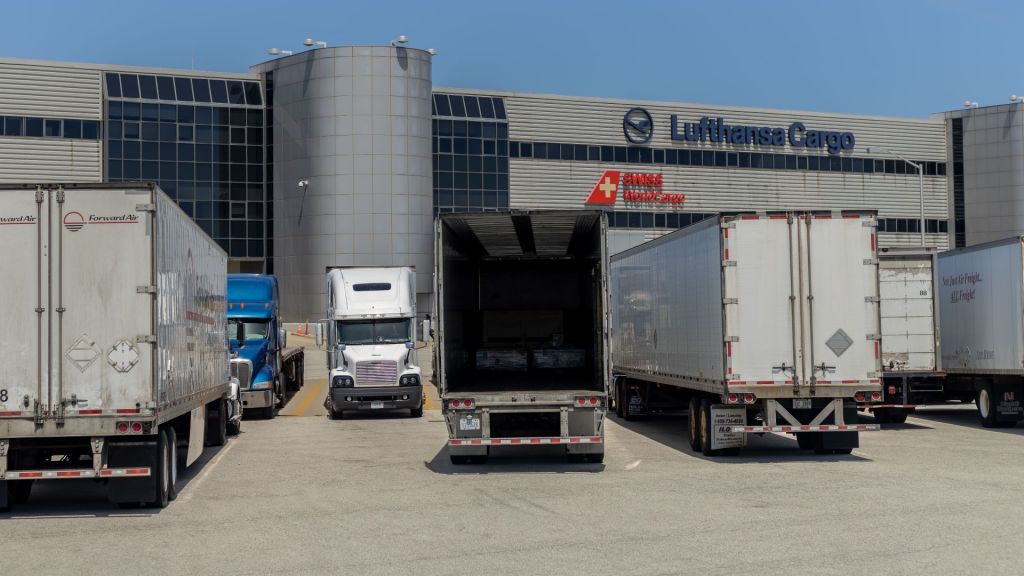
The Department of Transportation has little understanding of air cargo infrastructure challenges because officials, focused on other modes, don’t engage with industry officials and rely on incomplete and unreliable freight data, the Government Accountability Office said in a report released Wednesday.

The report catalogued a familiar list of complaints made by logistics providers, airlines and ground support companies about operational bottlenecks caused by insufficient truck parking, poorly configured roadways, crowded cargo aprons and outdated warehouses at airports. 

The Airforwarders Association, which pushed for the study in the FAA Reauthorization Act of 2024, is expected to use the results as the launch pad for requesting dedicated federal funding for enhancing cargo area infrastructure. 

The organization, which represents logistics companies that arrange and manage the transport of goods for producers and retailers, has long argued that federal funding formulas for airports typically support passenger operations, making it difficult for the cargo community to modernize infrastructure and reduce truck queues. It says cargo delays add costs across the air logistics sector and impede the timely delivery of goods, a prime example of which happened during the Covid crisis when it could take days for forwarders to retrieve shipments. 

“For years, we have highlighted the critical need for investment in our ground-based air cargo infrastructure. This report provides the irrefutable, government-backed evidence we need to drive real change and secure essential federal funding,” said AfA Executive Director Brandon Fried in a statement.

The GAO recommended that the assistant secretary for multimodal freight infrastructure and policy routinely communicate with air cargo stakeholders, identify challenges to the efficient movement of air cargo and determine whether the agency needs to take steps to address the constraints. It also called on the Bureau of Transportation Statistics to assess the reliability of air cargo data it compiles and to communicate the data’s limitations. 

The GAO said the department’s Multimodal Freight Office, which was established in 2023, has not tried to identify where air cargo congestion occurs and how to eliminate it, either through studying available data and state freight plans or routinely engaging with the air cargo community. It also doesn’t discuss air cargo issues or concerns with the department’s modal administrations, such as the Federal Aviation Administration or the Federal Highway Administration. And the FAA, for its part, doesn’t engage with the air cargo industry or passenger airlines about air cargo infrastructure needs, despite routinely communicating with airports and airlines regarding other matters. 

Data Limitations

The Bureau of Transportation Statistics’s Freight Analysis Framework (FAF) and National Transportation Atlas Database (NTAD) on airport warehouses were not sufficient to describe changes in air cargo value, commodities or infrastructure, the government auditors said.

The Department of Transportation, states, localities and companies use FAF data to assess the condition of freight infrastructure, plan projects and help allocate state and federal freight funding. While FAF data for other freight modes may use dozens of different datasets, the FAF air cargo data are based on two sources, one of which has known sampling error, the GAO said. Users are in the dark about these limitations because the Bureau of Transportation Statistics hasn’t provided clear explanations of the data’s limitations. 

The NTDA database describes the estimated location, number, size and operators of U.S. warehouses on airport property. The agency uses NTAD data to identify transportation vulnerability and resilience, and to support the Transportation Department’s response to critical incidents. Last year, for example, it used NTAD to assess freight disruptions between distribution centers and the Baltimore-Washington International Airport after the Francis Scott Key Bridge collapsed in Baltimore harbor.

The GAO determined NTAD air cargo data is not complete, timely, or accurate, with many warehouses not included. Bureau officials said it is difficult to accurately capture information on air cargo warehouses because warehouses change frequently, and air cargo stakeholders do not report warehouse data to DOT. They are now exploring methods to improve the quality of the NTAD data.

“Having information on air cargo challenges is critical for the Department of Transportation as it sets federal goals that will inform future investments and priorities for freight infrastructure in the U.S.,” the auditors said.

Click here for more FreightWaves/American Shipper stories by Eric Kulisch.

Write to Eric Kulisch at ekulisch@freightwaves.com.

Saudi Arabia-based leasing company to buy 10 Airbus A350 freighters

Airbus postpones rollout of A350 freighter until late 2027

China Airlines finalizes deal for 4 Boeing 777-8 cargo aircraft

Heartland Express books another loss in Q2

A white Heartland tractor pulling a white Heartland dryvan trailer

Truckload carrier Heartland Express reported an eighth consecutive net loss (excluding one-time real estate gains) during the second quarter. The North Liberty, Iowa-based company noted some sequential improvement from the first quarter but said market conditions remain unfavorable.

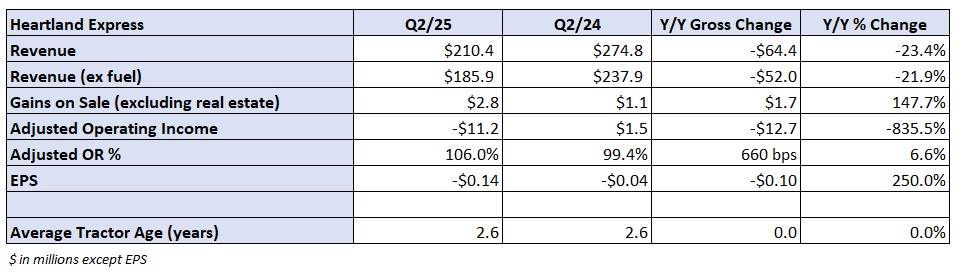
Heartland’s (NASDAQ: HTLD) $10.9 million net loss, or 14 cents per share, was worse than analysts’ expectations for a 7-cent-per-share loss. The result was also 10 cents worse than the year-ago loss. A $1.7 million year-over-year increase in gains on equipment sales provided a 2-cent tailwind (at a normalized tax rate) to the period.

Revenue fell 23% y/y to $210 million, which was $20 million shy of consensus. Excluding fuel surcharges, revenue was down 22% y/y. Like other TL carriers, Heartland has been culling its fleet count and walking away from some unprofitable freight. However, the latest downturn has been protracted and Heartland has been unable to orchestrate a turnaround at some of its previously acquired brands.

SONAR: Outbound Tender Reject Index for 2025 (blue shaded area), 2024 (green line) and 2023 (pink line). A proxy for truck capacity, the Outbound Tender Reject Index shows the number of loads being rejected by carriers. Current tender rejections are outperforming prior-year levels but still not signaling a recovery. To learn more about SONAR, click here.

Citing an “operating environment where current capacity outpaces weak freight demand,” Heartland CEO Mike Gerdin noted that TL fundamentals remain untenable.

“These dynamics coupled with what we perceive as unsustainable pricing in many markets and rising operating costs, continue to be a significant headwind for us and all of those operating in our industry,” Gerdin said in a Thursday news release.

(Heartland does not provide operating metrics for utilization and pricing.)

Table: Heartland Express’ key performance indicators

The company reported a 106% adjusted operating ratio (inverse of operating margin), 660 basis points worse y/y, but 110 bps better than the first quarter. An $11.2 million adjusted operating loss was nearly a $13 million swing from the prior-year quarter.

Salaries, wages and benefits expenses as a percentage of revenue were up 140 bps y/y. Depreciation and amortization expenses (up 290 bps), operations and maintenance (up 220 bps) and insurance and claims (up 200 bps) were also detractors.

The carrier continued to reduce rents and purchased transportation expenses, which were down 160 bps in the period.

Heartland’s legacy fleet remained profitable in the quarter and its Millis Transfer fleet returned to profitability. Both brands saw 400 bps of sequential OR improvement from the first quarter.

However, Smith Transport and Contract Freighters Inc. (CFI), both of which were acquired in the summer of 2022, shortly after the onset of the freight recession, were unprofitable again. Sequential results worsened at CFI as that fleet is in the process of converting to a new TMS.

All four fleets are expected to be operating on the same TMS by the end of the year, however, it could be a while before Heartland returns to profitability.

“While we have begun to see some encouraging signs within current freight demand and customer pricing, we do not expect material improvements until later in 2025 and a resulting positive impact to future financial results and an improved freight outlook in 2026,” Gerdin said.

The company continues to deleverage the balance sheet following the acquisitions.

Operating cash flows totaled $47 million in the first half of the year. Heartland reduced net debt (inclusive of financing lease obligations) by nearly $5 million in the quarter. It has reduced debt obligations by $300 million over the last three years.

Heartland ended the quarter with $88 million available on an untapped revolving credit facility.

The average tractor age remained elevated by Heartland’s historical standards at 2.6 years.

Shares of HTLD were down 1.4% at 11:00 EDT on Thursday compared to the S&P 500, which was up 0.3%.

More FreightWaves articles by Todd Maiden: